I Rebuilt 100 of My Bug-Bounty Findings Into Black-Box Labs, Then Sent Nine AI Agents In
I took 100 vulnerabilities I had found and submitted across 71 real bug-bounty programs, and rebuilt each one as an isolated, authorized, synthetic application. Then I sent AI agents in through a shell with no source code, no scenario specification and no answer key, which is the position I start from on a real program.
Opus 5 reached all four proof rungs on 63 of the 100 labs after two blind attempts. Grok 4.6 followed at 62. DeepSeek V4 Flash and Qwen3.8 Flash each reached 53, Qwen3.8 27B reached 51, and DeepSeek V4 Pro reached 48.
Those are the benchmark’s solve numbers. A solve requires the target to record all four operations and issue all four matching proofs. That exact-proof result is the single scoring system used throughout this article.
That is the result in one paragraph. It is also where the interesting questions begin.
Many public security evaluations for AI hand the model the source. That answers a real question, but not mine. In the web and API programs measured here, the hunter starts without the repository. The work is black-box: map the surface, establish identities and state, form a hypothesis, cross a boundary, carry the chain to impact, and prove it. So the labs give agents nothing but a target and a shell. Building 100 of them that behave like real applications, and that can verify their own exploitation from the inside, was most of the work behind this article.
The result does not make lower-cost models equivalent to the strongest models. It shows the standalone solve rate, rung progress, retry behavior and cost available at each model tier.
Executive summary
- I rebuilt 100 findings I had submitted across 71 real programs as isolated, authorized, synthetic Docker web and API labs. Agents worked black-box through a shell, with no source code; every target exposed four progressive exact proofs.
- A solve required all four target operations and all four matching proofs. Narrative claims and final-answer formatting did not create or remove solve credit.
- The public schedule used an initial blind pass and one blind retry on exact-proof misses. It stopped there. Each attempt had up to 80 turns and 25 minutes.
- Opus 5 reached 63 solves; Grok 4.6 reached 62. DeepSeek V4 Flash and Qwen3.8 Flash reached 53 each, followed by Qwen3.8 27B at 51, DeepSeek V4 Pro at 48 and Sol 5.6 at 45.
- Grok cost $327.28 compared with Opus at $569.08. It finished one solve behind Opus at 42% lower normalized cost.
- Qwen3.8 Flash reached 53 for $9.97, or $0.19 per solve. Opus cost $9.03 per solve, showing the capability-versus-cost trade rather than one universal winner.
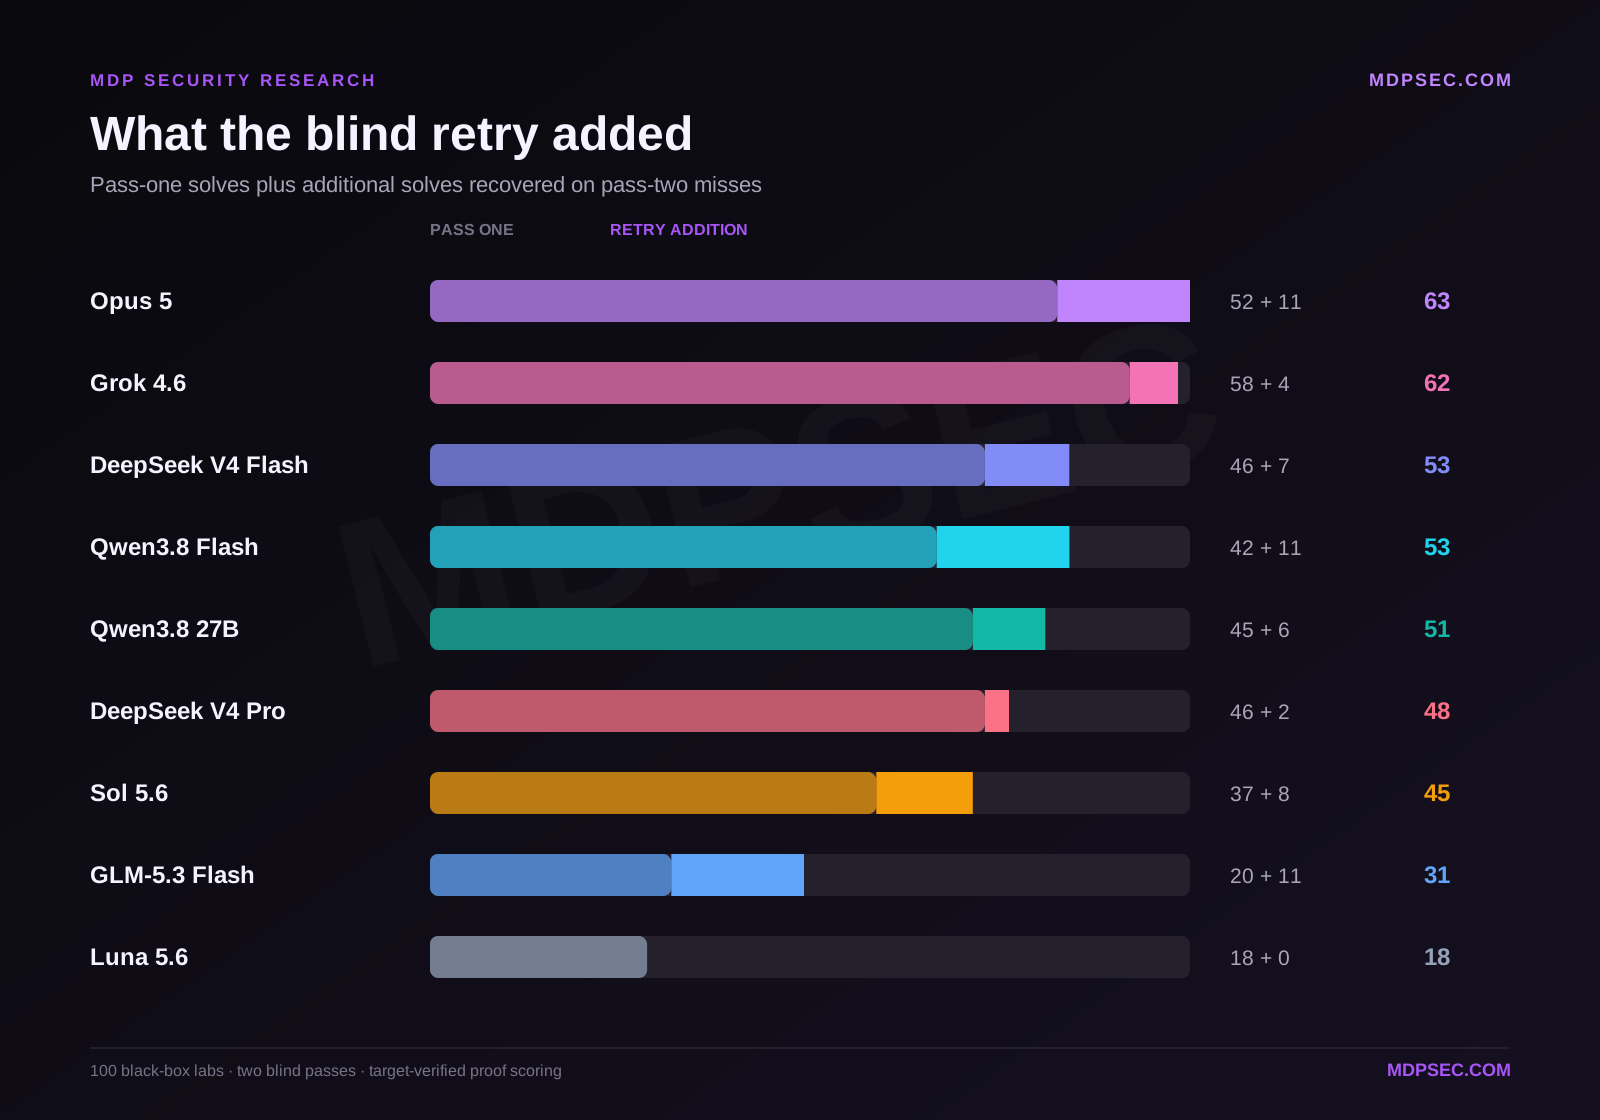
- The retry moved Qwen3.8 Flash from 42 to 53 and DeepSeek V4 Flash from 46 to 53. Both finished tied at 53 solves and 270 rungs.
- Sol 5.6 reached 45 for $106.71, or $2.37 per solve. It finished behind four cheaper models, including Qwen3.8 Flash at $0.19 per solve. Premium positioning did not by itself predict black-box hunting performance.
- Luna 5.6 reached 18 for $8.01, or $0.44 per solve. Its retry added rungs but no new solve. It is the floor of this panel, not a tier upset.
- At frozen 28 August 2026 OpenRouter base list prices, normalized standalone costs ranged from $3.36 for GLM Flash to $569.08 for Opus. These are comparable base-rate estimates, not historical invoices, subscriptions or total ownership costs.
Standalone results
A few terms, used consistently from here on.
A cell is one model-lab attempt. Each cell had at most 80 turns and 25 minutes. Where infrastructure forced a restart, only the final resolved attempt for that cell, its canonical attempt, contributes proofs, timing or token volume. A solve means the target recorded all four operations and all four exact proofs appeared in the trace. A rung is one verified step in that chain.
“Median cell time” is the median wall time of one canonical attempt, not total benchmark runtime or concurrent throughput. “Priced tokens” is billing volume, including uncached input, cache activity and output. “Normalized API cost” applies one dated OpenRouter base-rate sheet so every model is priced by the same method, and “cost / solve” divides that figure by the final solve count.
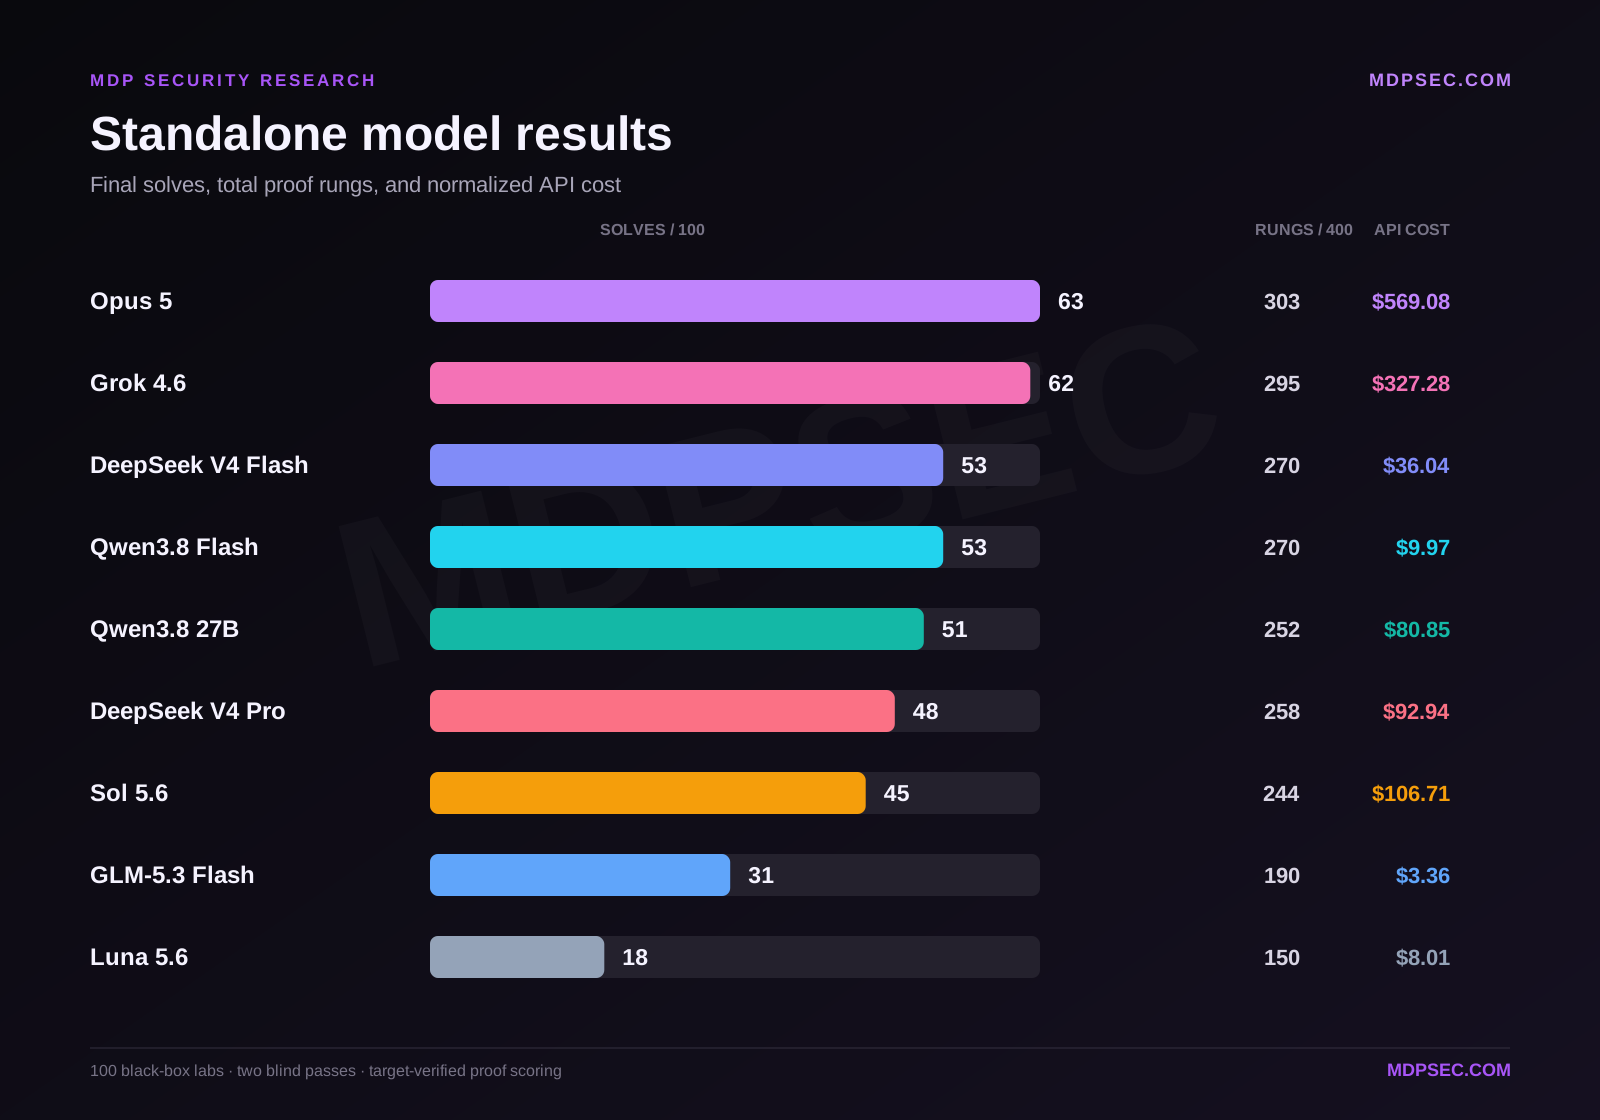
Full benchmark data
| Model | Pass one: solves / rungs | Retry added: solves / rungs | Final: solves / total rungs | Median cell time | Total priced tokens | Normalized API cost | Cost / solve |
|---|---|---|---|---|---|---|---|
| Opus 5 | 52 / 267 | +11 / +36 | 63 / 303 | 16.4m | 554.6M | $569.08 | $9.03 |
| Grok 4.6 | 58 / 284 | +4 / +11 | 62 / 295 | 17.9m | 416.1M | $327.28 | $5.28 |
| DeepSeek V4 Flash | 46 / 246 | +7 / +24 | 53 / 270 | 20.2m | 1.818B | $36.04 | $0.68 |
| Qwen3.8 Flash | 42 / 228 | +11 / +42 | 53 / 270 | 21.4m | 326.2M | $9.97 | $0.19 |
| Qwen3.8 27B | 45 / 227 | +6 / +25 | 51 / 252 | 25.0m | 598.6M | $80.85 | $1.59 |
| DeepSeek V4 Pro | 46 / 241 | +2 / +17 | 48 / 258 | 25.0m | 973.3M | $92.94 | $1.94 |
| Sol 5.6 | 37 / 215 | +8 / +29 | 45 / 244 | 9.8m | 185.6M | $106.71 | $2.37 |
| GLM-5.3 Flash | 20 / 148 | +11 / +42 | 31 / 190 | 7.2m | 160.4M | $3.36 | $0.11 |
| Luna 5.6 | 18 / 137 | +0 / +13 | 18 / 150 | 5.6m | 108.7M | $8.01 | $0.44 |
Every row contains 100 pass-one cells plus one pass-two cell for each pass-one miss, so the retry denominator is always 100 minus the pass-one solve count: 48 cells for Opus and 82 for Luna.
Cost per solve spans roughly 80 times, and it does not rank the models the way capability does. Read it against the final total in the same row: GLM’s $0.11 is the cheapest figure in the table, but it bought only 31 solves. The section on normalized cost returns to this.
The benchmark I wanted did not exist
Most security benchmarks answer a legitimate but different question from the one I care about as a bug-bounty hunter.
Can a model answer a question about an exploit? Can it identify a vulnerable line of code? Can it solve a capture-the-flag challenge with a known category? Those tasks matter, but they do not reproduce the uncertainty of a black-box application where the agent has to decide what to enumerate, which response difference matters, how identities and objects relate, and whether an apparent weakness can be carried to impact.
CyberBench, CyBench, CyberGym, CVE-Bench and similar suites are useful, but they commonly measure security knowledge, CTF execution, known-CVE reproduction, source-assisted analysis or a structured vulnerability objective. Those settings can show whether a model understands security or can operate once the problem has already been framed. They do not directly answer the bug-bounty question measured here.
The normal starting condition for web and API bounty hunting is a deployed target and a scope, not a repository, known CVE or answer key. The hunter has to discover the relevant surface, determine whether anything is actually vulnerable, build the required state and carry the finding to impact. This benchmark was built to represent that black-box workflow, while keeping the targets synthetic, isolated and exactly verifiable. It is therefore a more direct test of which agent systems can find and complete black-box web and API vulnerabilities, rather than which models know the most security facts or perform best once the vulnerable component is already identified.
In real web and API hunting, naming the bug class is rarely the finish line. The work often looks more like this:
- map the reachable surface;
- establish identities, roles, tenants, resources and state transitions;
- form a vulnerability hypothesis;
- create the preconditions needed to test it;
- distinguish a noisy response from a reproducible authorization or logic failure;
- continue the chain far enough to demonstrate meaningful impact;
- preserve evidence without causing unnecessary harm; and
- explain the result in a form another person can reproduce.
An agent can sound knowledgeable while failing at almost every step in that sequence. This benchmark therefore credits only target-verified operations and exact proofs, not the model’s narrative.
What the public table compresses
This was not one prompt sent to a list of models.
Behind the table sits a larger engineering and research program: 100 executable applications, 400 target-proof rungs, two blind evaluation passes, isolated instances, tool-enabled agent runs, retained traces, terminal scoring, target-proof reconciliation and a price reconstruction built from token classes rather than subscription marketing.
Across the nine standalone experiments reported here, the canonical two-pass ledgers contain 5.14 billion priced tokens. Successful cells stopped after pass one; unresolved cells received one second blind attempt. Infrastructure failures and superseded physical retries were excluded from the like-for-like capability and token totals rather than allowed to inflate a model’s result or cost.
I came to the benchmark as a bug-bounty hunter, not a model vendor. By August 2026, my public record covered 286 submitted reports, including 94 critical and 96 high-severity findings, with a focus on web applications, APIs, access control and business logic. That experience shaped the mechanisms I wanted the labs to preserve and the shortcuts I did not want the benchmark to reward.
The value of publishing the work is therefore larger than a model ranking. The benchmark offers a reproducible way to separate first-attempt solves, blind-retry recovery, total verified progress and model-token cost. Those distinctions are what turn a leaderboard into a decision a hunter or security team can actually use.
Where the 100 labs came from
The benchmark contains 100 Dockerized web and API scenarios. Each one was derived from a specific vulnerability I had found and submitted on a real program, not from a vulnerability taxonomy, a textbook or a generator.
| Source corpus | |
|---|---|
| Distinct bug-bounty programs | 71 |
| Severity of the source finding | 36 critical, 37 high, 27 medium |
| Vulnerability classes | auth bypass 41, IDOR 24, SSRF 12, information disclosure 7, XSS 7, business logic 3, SQL injection 3, RCE 3 |
| Proof rungs per lab | 4 (400 across the panel) |
The class row describes the original finding. The mechanism families further down describe the rebuilt lab, which is a different cut of the same 100 scenarios.
That distribution is the reason the panel is weighted toward access control and identity rather than memory safety or cryptography. It reflects what actually gets found on web and API programs, which is the population I wanted the agents measured against.
The environments are synthetic reconstructions, not copies of programs. Real program names, domains, credentials, requests, customer data, proprietary code and report prose were excluded. Each scenario was rebuilt as an isolated application with its own generated certificate and target-issued proofs. The benchmark is therefore shaped by real hunting experience without turning real third-party material into a public dataset.
An ownership report, for example, did not become a copy of the affected product. I reduced it to the invariant that mattered: two principals, one resource, a state-changing operation and an ownership check that should bind all four. The synthetic application changed the product surface and data model while preserving that causal chain. The verifier watched the state transition, not a hard-coded answer string.
Each scenario runs in its own isolated Docker project, which provides fresh state for every physical attempt, topology-enforced boundaries, deterministic reset and hidden event capture. A certificate binds the expected lab and its proof contract to the instance actually under test, and generated identities and secrets differ every time. No agent ever holds a universal answer key, a proof copied from another run cannot establish success, and the verifier can tell an operation genuinely performed against the current target apart from a plausible-looking claim about one.
What the labs asked agents to do
The scenarios were designed around mechanisms, not vulnerability labels alone. An agent could not receive credit merely by saying “this looks like IDOR” or “test for SSRF.” It had to create the right application state and cause the isolated target to issue the corresponding proof.
The 100 labs group into fifteen mechanism families:
| Family | Labs | Family | Labs |
|---|---|---|---|
| Route guard gap | 11 | Async export disclosure | 6 |
| SSRF internal | 11 | Injection sink | 6 |
| Tenant boundary | 9 | Account recovery chain | 5 |
| Key material exposure | 8 | Credential ceremony chain | 5 |
| Token scope chain | 8 | Stored content execution | 5 |
| Entitlement transition | 7 | Dependency artifact | 4 |
| Object ownership | 7 | Parser normalization differential | 1 |
| Workflow transition | 7 | Total | 100 |
Family sizes are uneven because they follow the source corpus rather than a quota. Several are far too small to carry a claim on their own, which is why every result in this article is reported across the whole panel rather than broken out by family.
Eight of those families illustrate the kind of work involved:
| Family | The kind of black-box work required |
|---|---|
| Object ownership | Create or identify resources under different identities, then test whether an object boundary survives reads, writes or state changes |
| Tenant boundary | Establish separate organizational contexts and determine whether identifiers, memberships or workflows cross the tenant boundary |
| Token-scope chain | Obtain tokens through legitimate flows, compare scopes and test whether a downstream service honors the intended authority |
| Async export disclosure | Trigger background work, track job identifiers and determine whether the resulting export can be retrieved outside its owner or tenant |
| Workflow transition | Move an object through prerequisite states, then attempt a transition that should require a role, previous step or business condition |
| SSRF internal | Find a server-side fetch surface, control the destination and demonstrate access to an isolated internal service |
| Parser normalization differential | Construct an input interpreted differently by two layers and carry the discrepancy to a security-relevant effect |
| Injection sink | Reach a sink through the application workflow and obtain target evidence of execution rather than stopping at reflected input |
Other scenarios combined client artifacts, recovery flows, entitlement changes, dependency metadata and multi-principal state. The point was not to create 100 copies of one access-control bug. It was to force agents to repeatedly answer the harder black-box questions: What state exists? Which principal owns it? What transition is possible? What evidence distinguishes impact from noise?
Black-box access
The agents received a target description, scope boundary and shell. They could use command-line tools to interact with the web application or API, retain evidence and iterate. They did not receive source code for the target.
This is not “browser only,” and it is not a pure language-model test. The experimental unit is the model acting through a harness with tools, a prompt, a context policy, a timeout and retained evidence. That is deliberate: a deployable security agent is a system, not a model card.
Four progressive proof rungs
Every lab exposed four progressive rungs. The exact meaning differed by mechanism, but the shape was consistent:
- Rung 1: establish a meaningful surface or precondition;
- Rung 2: cross the first security-relevant boundary;
- Rung 3: continue the chain toward consequential state or access; and
- Rung 4: complete the intended vulnerability chain.
The target issued an instance-specific proof when the corresponding operation occurred. This gave the benchmark partial credit without rewarding verbosity. A long explanation with no target proof earned no rung. Four exact proofs in the retained trace established a solve. Across the panel that is 400 possible rungs.
What counted as a solve
A rung required two matching facts: the isolated target’s hidden verifier recorded the required operation, and the retained agent trace contained that instance’s exact target-issued proof. A solve required all four rungs under that rule.
The scorer does not accept the model’s narrative as evidence. It also does not promote broader diagnostic milestones into rung credit. The single truth table throughout this article is therefore based on target-verified proofs: pass-one solves and rungs, retry additions, and final solves and total rungs.
The protocol: blind once, then blind again
The public evaluation uses one information condition and two stages:
- Blind pass one. Every model receives the same broad target brief, with no vulnerability category, source code or narrowing hint.
- Blind pass two. Only labs without all four exact proofs run again. The model receives the same target information but a different sampling seed, creating a fresh trajectory rather than continuing the first conversation.
Successful scenarios stop after pass one. This avoids paying for another attempt on a target already completed and concentrates the second rollout on the difficult tail. Because both passes are blind, every number in the public comparison measures black-box solve performance under the same information condition.
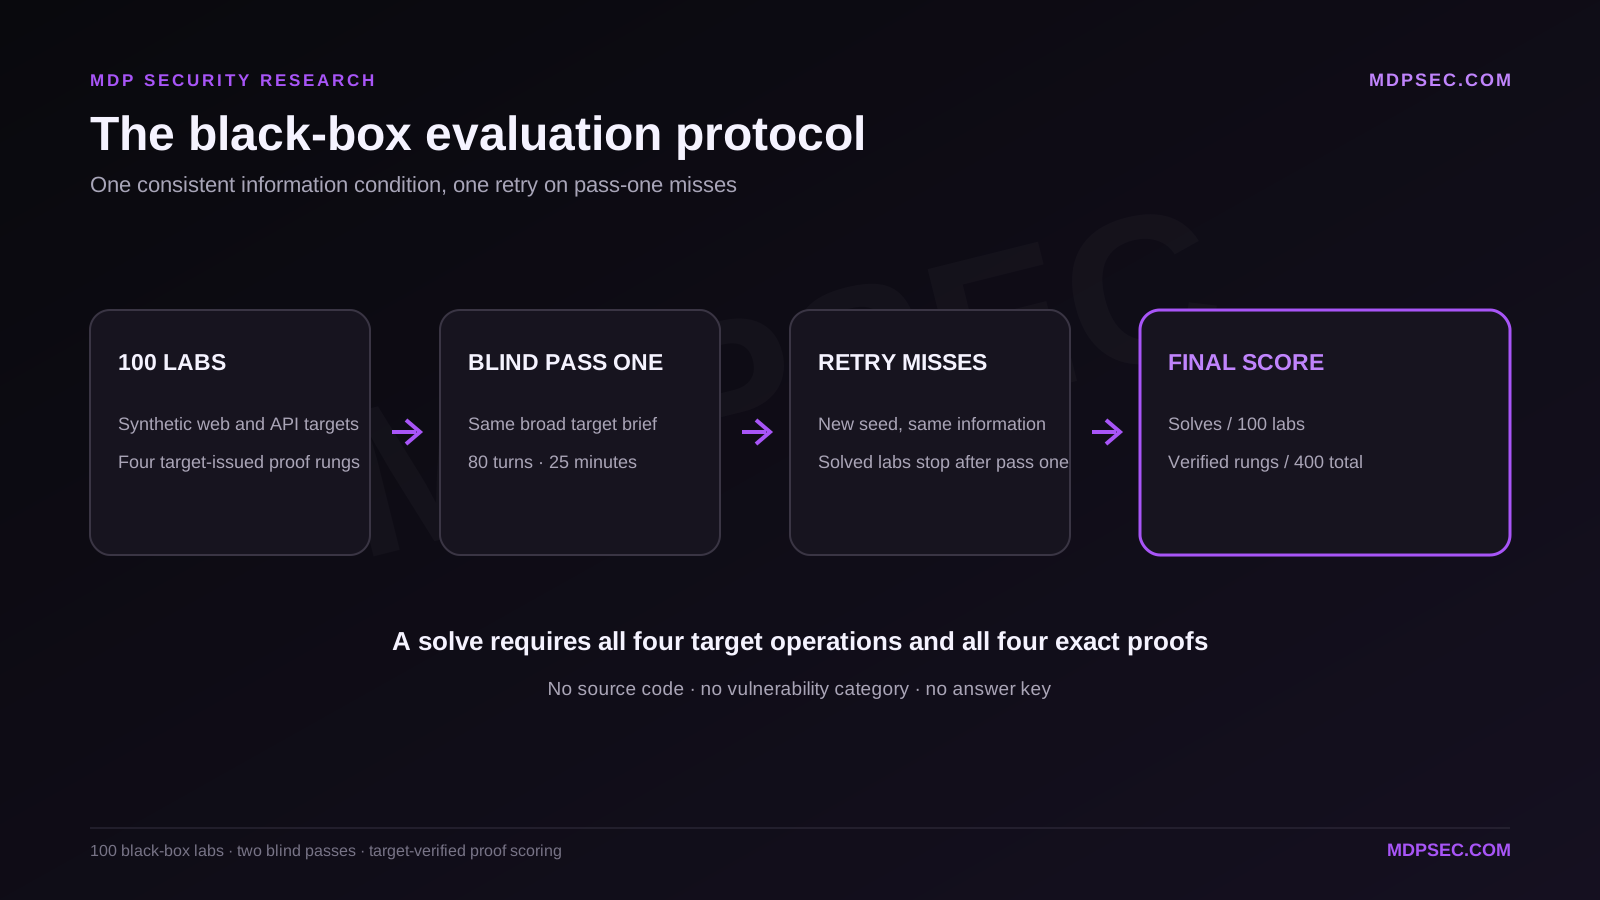
Models, harnesses and effort labels
| Model | Vendor | Reasoning effort | Agent harness | Treatment |
|---|---|---|---|---|
| Opus 5 | Anthropic | High | Claude Code | Blind pass one, then pass two on misses |
| Grok 4.6 | xAI | High | Grok Build | Blind pass one, then pass two on misses |
| Sol 5.6 | OpenAI | High | Codex | Blind pass one, then pass two on misses |
| DeepSeek V4 Flash | DeepSeek | Max | Codex | Blind pass one, then pass two on misses |
| Qwen3.8 Flash | Alibaba | High | Codex | Blind pass one, then pass two on misses |
| Qwen3.8 27B | Alibaba | Medium | Codex | Blind pass one, then pass two on misses |
| DeepSeek V4 Pro | DeepSeek | Max | Codex | Blind pass one, then pass two on misses |
| GLM-5.3 Flash | Zhipu AI | High | Codex | Blind pass one, then pass two on misses |
| Luna 5.6 | OpenAI | High | Codex | Blind pass one, then pass two on misses |
The harness difference stays visible, and it is not evenly distributed. Four models ran inside their own vendor’s agent: Opus in Claude Code, Grok in Grok Build, and both OpenAI models in Codex. The other five, DeepSeek Pro and Flash, both Qwen deployments and GLM, ran inside Codex as a common third-party host. This gives them common tooling but is not their native pairing. Each harness exposes a shell, but their prompts, tool schemas, context handling and terminal events are not identical, so a score here belongs to the model inside its harness, not to the weights alone. I record effort labels for reproducibility, but High and Max are not standardized quantities across vendors.
Why each model uses a different effort level
I did not assume that the largest reasoning label would produce the best hunter. Across this research program, the agents consumed billions of tokens in controlled evaluations and authorized black-box hunting workflows. I used that earlier evidence, not the blind passes reported here, to find the practical sweet spot for each model, then froze the effort level before this evaluation ran rather than automatically selecting max or xhigh.
Reasoning labels are also vendor-specific. High, xhigh and max are not comparable units of compute across providers. A larger label can increase token use and wall time without improving the solve rate, and in some cases it changes how long the agent deliberates without improving whether it completes the vulnerability chain.
Higher effort is not inherently worse, but the best setting is model-specific and workload-specific. Both DeepSeek runs use Max, Qwen Flash uses High and Qwen3.8 27B uses Medium because those settings best reflected their practical black-box hunting performance.
Reading each result without flattening it
Opus 5 was the strongest model after both passes. Grok led pass one, but Opus moved from 52 to 63 on the retry and finished one solve ahead. It still missed 37 labs and earned 303 of the 400 possible rungs.
Grok 4.6 was the strongest one-shot model. It led pass one at 58 / 284 and finished one solve behind Opus after the retry at 62 / 295, for 58% of Opus’s normalized cost.
The two Flash models tied at 53 / 270 by different routes. DeepSeek Flash reached 46 solves on the first blind pass against Qwen’s 42. Qwen Flash recovered more on the retry, adding eleven solves and 42 rungs, and did so at $9.97 compared with DeepSeek Flash’s $36.04.
DeepSeek V4 Pro did not justify a simple tier assumption. It reached 48 solves and 258 rungs at a normalized cost of $92.94. It was also one of the two models whose median cell reached the 25-minute limit.
Sol 5.6 is the panel’s clearest disappointment relative to expectation. It is a premium model, run at high effort inside its own vendor’s harness, and it finished seventh of nine at 45 / 244, behind both Flash models, DeepSeek Pro and Qwen3.8 27B. It was also the third most expensive arm in the benchmark. Its 9.8-minute median shows that timeouts were not its primary constraint; a typical cell ended with substantial budget remaining.
Qwen3.8 27B and GLM-5.3 Flash produced distinct middle and lower-panel profiles at 51 / 252 and 31 / 190. GLM accumulated 190 rungs while solving only 31 labs, so it made partial progress but stopped short of complete chains far more often than the leaders.
What pass two changed
Pass one and pass two are already separated in the main table, but the change in ordering matters. Grok led the first attempt with 58 solves, followed by Opus at 52. The retry added eleven solves for Opus, eleven for Qwen Flash, eleven for GLM, eight for Sol, seven for DeepSeek Flash, six for Qwen3.8 27B, four for Grok and two for DeepSeek Pro. Opus therefore moved past Grok, while Qwen erased DeepSeek Flash’s four-solve first-pass lead.
Luna was the exception. Its retry added thirteen rungs but no new solve, leaving it at 18 / 150. Luna is also the one model that originally ran its second pass unconditionally, on all 100 labs rather than only on misses. The schedule-normalized row above keeps only the 82 seed-two cells that the common protocol would have run. The result shows that a retry is useful only when a model’s failures are recoverable rather than systematic.
The stopping rule matters. Unlimited attempts can convert cost into apparent capability while hiding poor reliability. Publishing the first attempt, one prescribed retry and the marginal gain keeps that trade visible.
Partial progress on unsolved labs
A solve count is easy to communicate, but it throws away information about the difficult tail. Two models can finish level on solves and differ sharply in how far they got on everything they did not finish.
The main table already carries that information; it just needs dividing. Subtract four rungs for every solved lab, and what remains is progress earned on labs the model never closed.
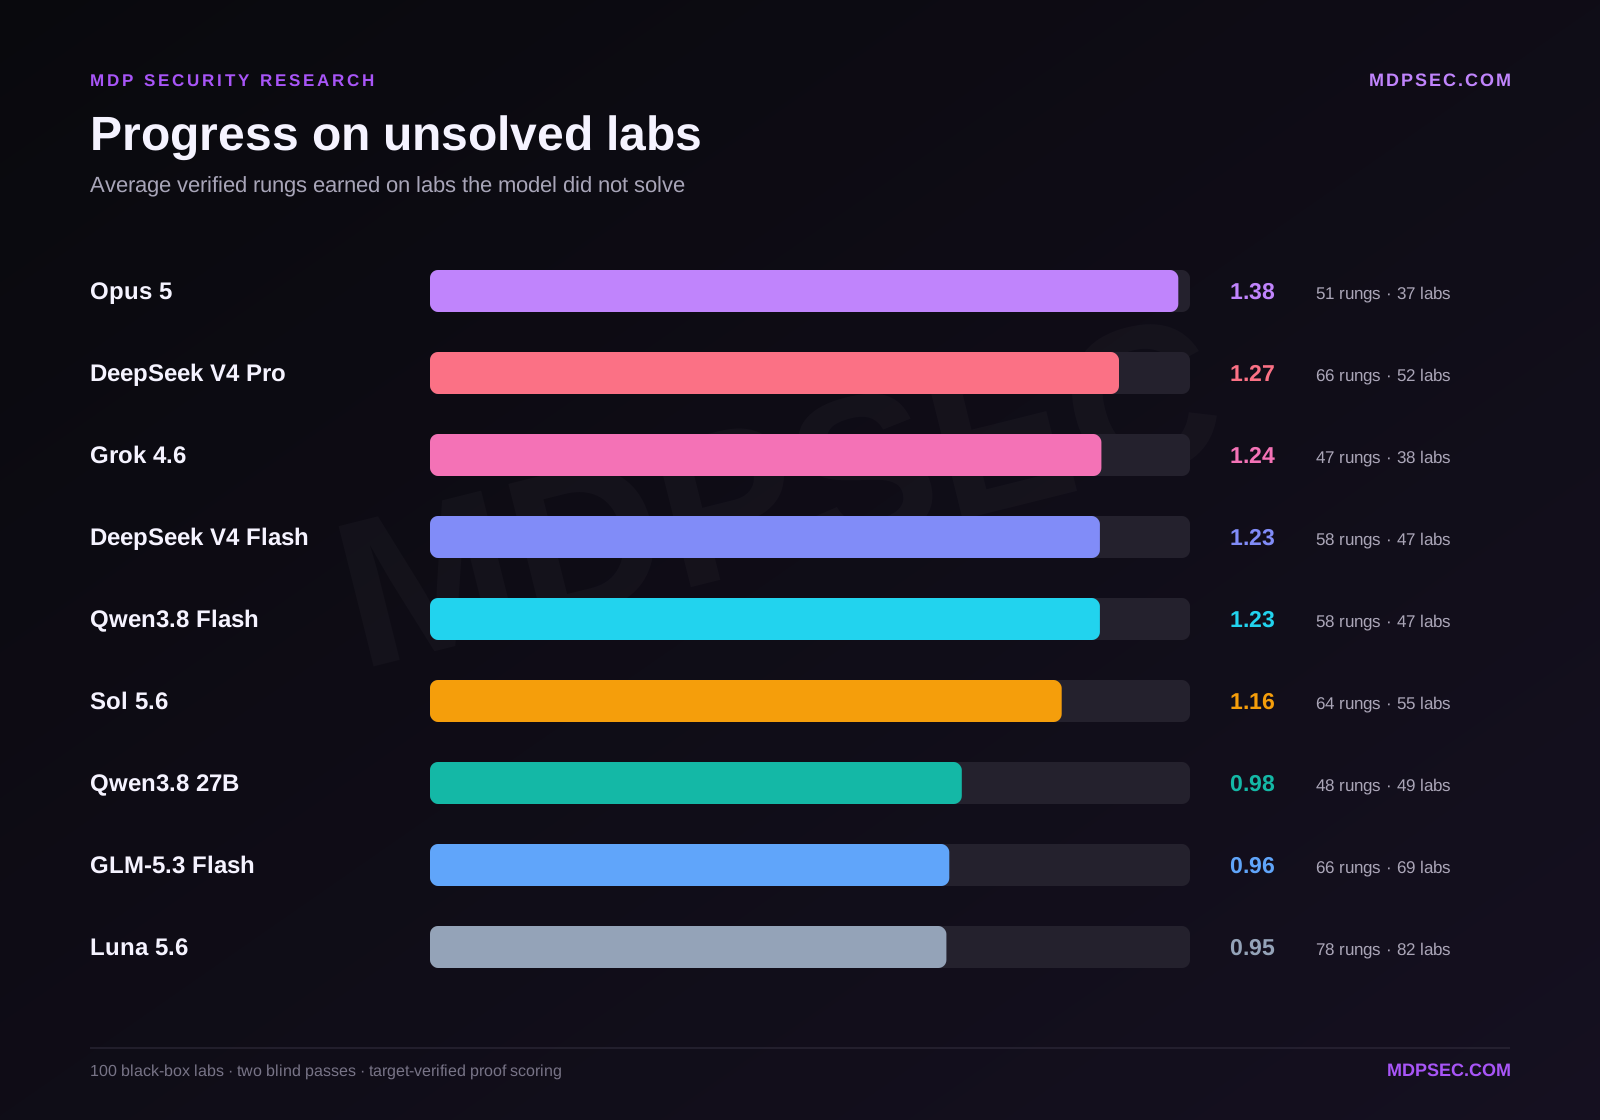
Opus led here too: even on the 37 labs it failed, it averaged 1.38 rungs. DeepSeek Pro’s 1.27 shows that it repeatedly built real partial capability without completing the chain. At the bottom, GLM’s 190 rungs look substantial until the division: under one rung per unsolved lab means it mostly established a surface and stopped.
For model selection, solves answer “how many targets reached the endpoint?” Rungs per unsolved lab answers “when it failed, how close did it get?” Both views matter more than a single percentage.
Normalized API cost: one price sheet, the recorded token mix
Cost comparisons are easy to manipulate accidentally.
Subscription credits, direct-provider peak and off-peak pricing, negotiated plans, rented GPUs and different cache definitions cannot be placed in one table without creating false precision. For the primary comparison, I used a single rate card: OpenRouter’s public per-token list prices as observed on 28 August 2026.
I applied those prices only to requests belonging to blind pass one or blind pass two:
- uncached input;
- cache reads;
- cache writes where recorded;
- output; and
- one canonical resolved attempt for each selected logical cell.
Each request’s recorded usage was matched to its canonical cell using provider, executor, the exact run interval and the isolated container network. Three Qwen3.8 27B cells without a unique usage record fall back to their retained trace usage. Superseded retries are excluded. Qwen Flash’s OpenRouter and Qwen Cloud segments are de-duplicated and both repriced at the same OpenRouter Qwen3.8 Flash rates.
The result is a normalized base-list-price estimate, not a reconstruction of what every provider historically invoiced, and for any arm not purchased through a public API it is a counterfactual repricing of the recorded token mix at the same public rates. Context-length price overrides are ignored for every model; the same advertised base rate applies regardless of prompt length.
Long-running agents repeatedly resend expanding transcripts, so cache classes materially change the estimate. The effect is largest for Opus, where 526M of its 555M priced tokens are cache reads and the cache classes together account for roughly 70% of its bill. The rate card, in dollars per million tokens:
| Model | Input | Cache read | Cache write | Output |
|---|---|---|---|---|
| Opus 5 | 5.00 | 0.50 | 6.25 | 25.00 |
| Grok 4.6 | 2.00 | 0.50 | n/a | 6.00 |
| Sol 5.6 | 2.00 | 0.20 | 2.50 | 10.00 |
| Luna 5.6 | 0.20 | 0.020 | 0.25 | 1.20 |
| Qwen3.8 27B | 0.425 | 0.085 | 0.53125 | 2.55 |
| DeepSeek V4 Pro | 0.87 | 0.0725 | n/a | 1.74 |
| Qwen3.8 Flash | 0.15 | 0.016 | 0.20 | 0.47 |
| DeepSeek V4 Flash | 0.0886 | 0.0177 | n/a | 0.1772 |
| GLM-5.3 Flash | 0.075 | 0.015 | n/a | 0.25 |
The resulting standalone token volumes and normalized costs are included in the main results table. Across the nine standalone experiments, the canonical ledgers total 5.14B priced tokens and $1,234.25 at the frozen base rates. That is priced billing volume, dominated by repeated cache reads, not 5.14B tokens of unique text.
What the cost difference means
Sorted by cost per solve, the panel barely resembles the solve ranking: GLM $0.11, Qwen Flash $0.19, Luna $0.44, DeepSeek Flash $0.68, Qwen3.8 27B $1.59, DeepSeek Pro $1.94, Sol $2.37, Grok $5.28, Opus $9.03.
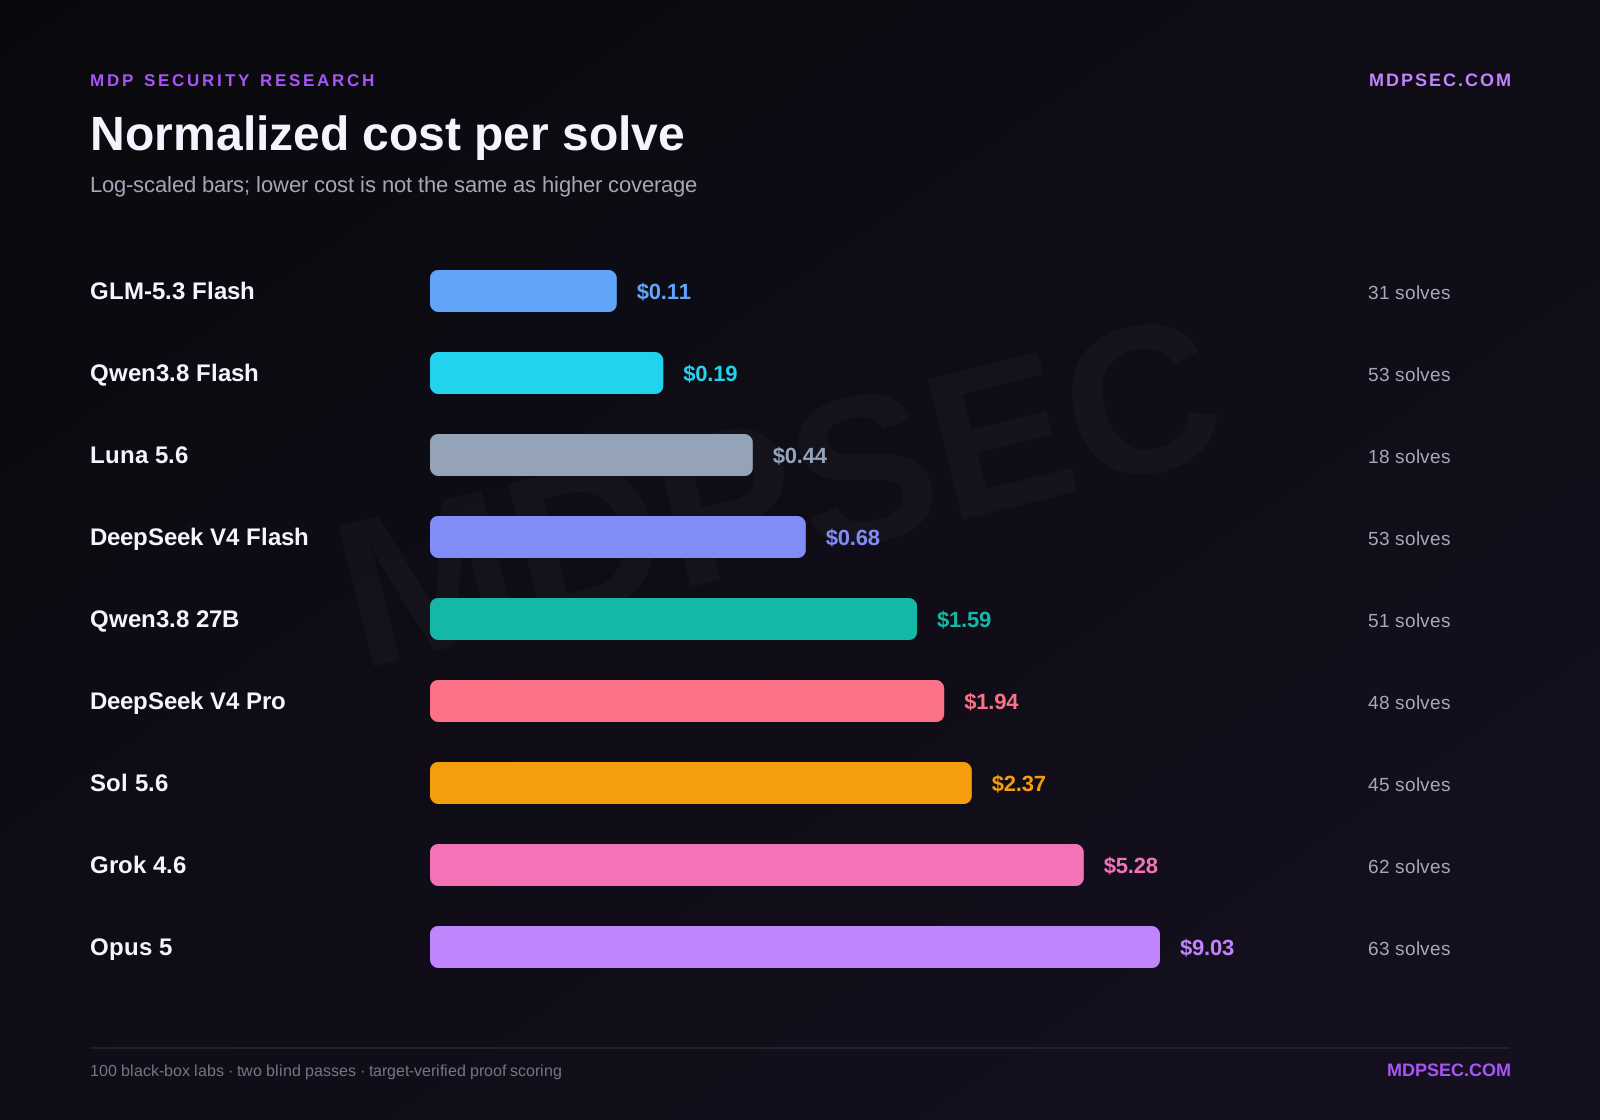
Qwen Flash is the result that makes the ratio worth publishing: 84% of Opus’s solves for 2% of the money. It is also the point at which a single ratio starts to mislead. The cheapest figure in that list belongs to the model that finished eighth of nine on solves, and the third cheapest to the model that finished last. Efficiency measured only over successes says nothing about the failures, and on a live program a missed finding is not free because another hunter may find it first.
So a cheaper model may be attractive for broad autonomous coverage, while a stronger but more expensive model may justify its cost on higher-value targets where a miss is the expensive outcome. Grok is the interesting middle: second on solves at 58% of Opus’s cost and $5.28 per solve.
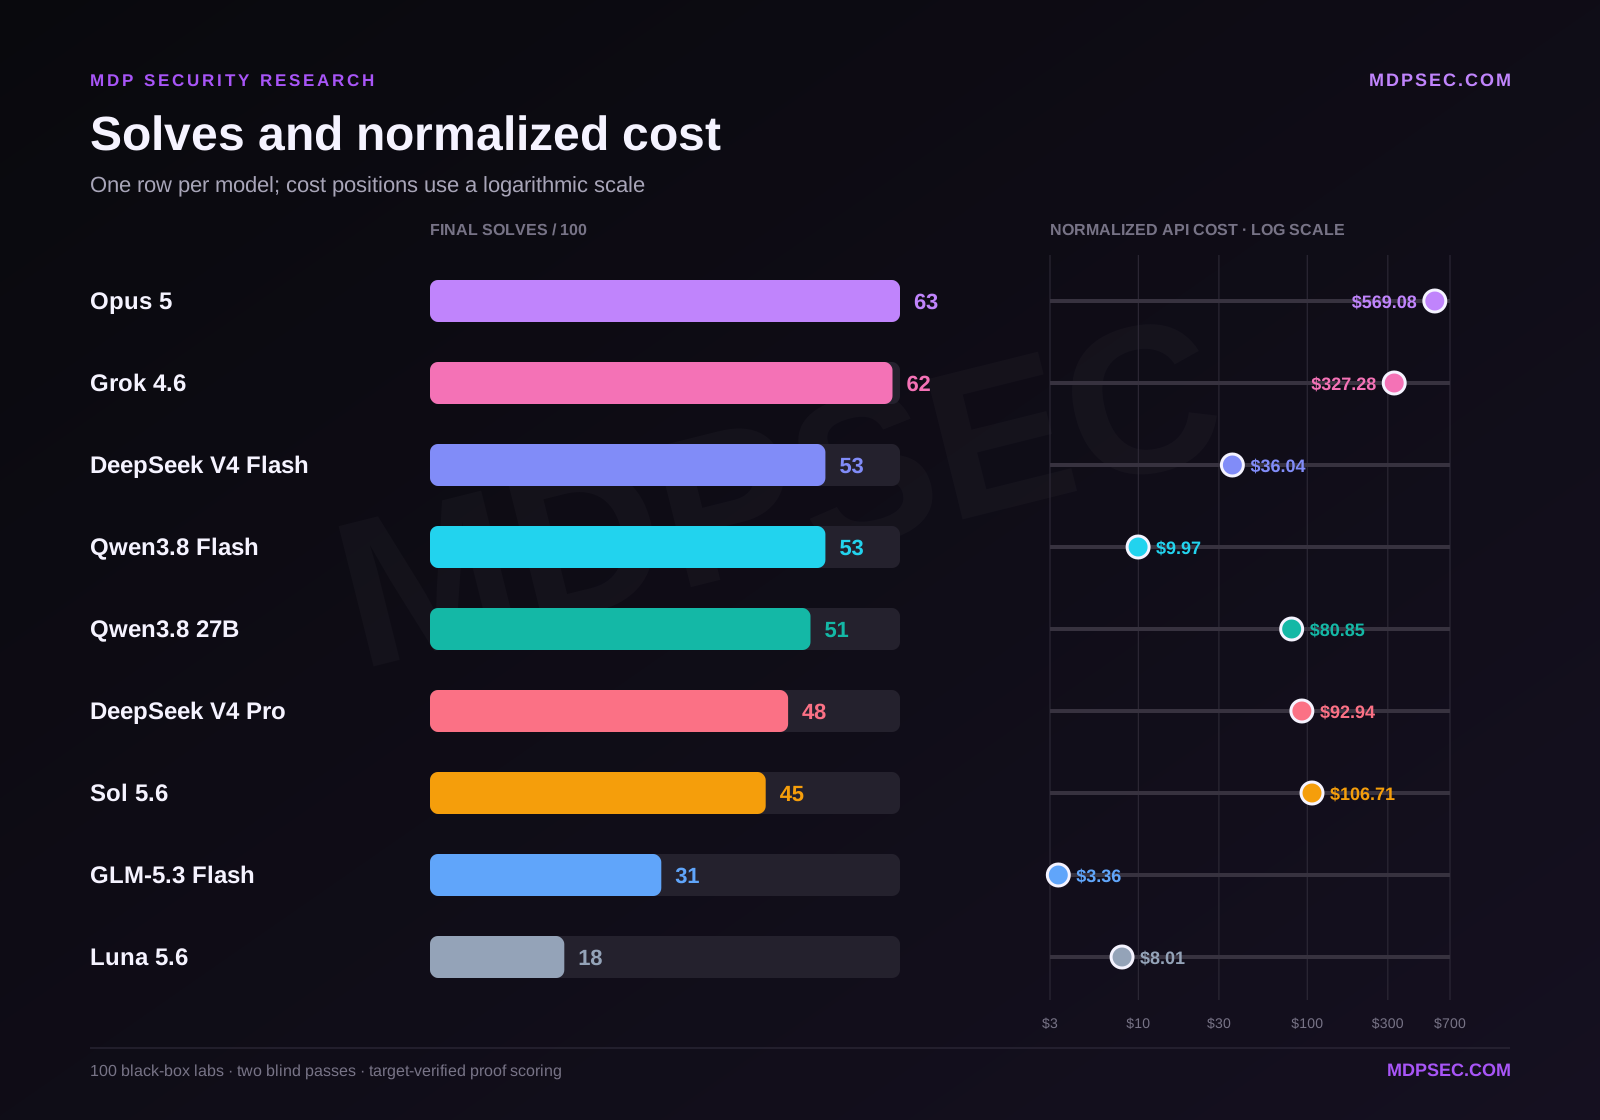
DeepSeek Pro also cost more than DeepSeek Flash while finishing five fewer labs and twelve fewer rungs. Solves, rung coverage and cost have to be read together.
What the normalized estimate leaves out
The table prices model tokens only. It does not include:
- the Docker host and scenario orchestration;
- storage for traces and evidence;
- the CPU cost of harnesses and terminal tools;
- superseded retries and broader operational retry overhead;
- engineering and monitoring time;
- human review and report writing;
- taxes, credit expiry or subscription minimums; or
- provider web-search charges, which the benchmark did not use.
Those exclusions keep the question narrow: if the recorded model token mix were purchased through one public API rate card, what would the model inference cost?
The answer is not total cost of ownership. It is the cleanest way to compare the inference premium attached to the observed coverage.
A premium tier did not reliably mean better
DeepSeek produced the clearest inversion within a single product family.
| Model | Solves | Total rungs | Normalized estimate |
|---|---|---|---|
| DeepSeek V4 Flash | 53 | 270 | $36.04 |
| DeepSeek V4 Pro | 48 | 258 | $92.94 |
Pro consumed fewer tokens than Flash but cost more under its higher OpenRouter base rates. Flash found five more solves and twelve more rungs. The timing data supports one explanation: 107 of Pro’s 154 canonical cells reached the time boundary, so it frequently spent the full budget without completing the chain.
Sol 5.6 is the second and larger instance, across vendors rather than within one. It is a premium model running at high effort in its own vendor’s harness, and four cheaper models finished ahead of it:
| Model | Solves | Total rungs | Normalized estimate |
|---|---|---|---|
| DeepSeek V4 Flash | 53 | 270 | $36.04 |
| Qwen3.8 Flash | 53 | 270 | $9.97 |
| Qwen3.8 27B | 51 | 252 | $80.85 |
| DeepSeek V4 Pro | 48 | 258 | $92.94 |
| Sol 5.6 (premium) | 45 | 244 | $106.71 |
Qwen Flash is the sharpest comparison: eight more solves and 26 more rungs at roughly a tenth of the cost. Sol’s failure mode also differs from DeepSeek Pro’s. Pro frequently reached the time boundary; Sol’s median cell finished in 9.8 minutes against a 25-minute budget, and it earned 1.16 rungs on each lab it did not complete. A typical Sol cell ended with more than 15 minutes remaining.
Two inversions in one panel, one within a product family and one across a tier boundary, are enough to say that neither the tier name nor premium positioning predicted the stronger black-box hunting result here. They are not enough to say premium models are weak in general: Opus and Grok finished first and second.
What I would take into AI-assisted bug-bounty hunting
The benchmark gives each model a different standalone operating point.
1. Choose the model for the required capability and cost
Opus and Grok produced the strongest standalone solve counts. Qwen Flash delivered the strongest cost-to-solve result among the leading lower-cost models at $0.19 per solve. The right choice depends on the value of the targets, latency and budget.
2. Preserve state outside the conversation
Keep a structured evidence ledger containing identities, objects, requests, responses, target-issued proofs, tested hypotheses and failed branches. An agent should not have to rediscover a valid proof because context was compacted or the run approached its deadline.
3. Run one clean blind retry on valuable misses
The second blind pass erased the DeepSeek/Qwen ranking gap and added eleven Qwen, seven DeepSeek and eleven Opus solves. Luna added none. Measure recovery per model before budgeting repeated passes; the marginal value varied dramatically here.
4. Keep a human at the scope and impact boundary
These labs verify target state. They do not decide whether a live action is allowed, whether a finding is novel, how severe it is, whether another user could be harmed, or how to communicate responsibly with a program.
In practice that is three steps: the chosen model runs blind pass one; one independent blind retry runs on selected misses; a human then validates, assesses impact and writes the report. The process should stop when marginal expected value falls below marginal cost or risk. More inference is not automatically better.
What I excluded from the principal comparison
Not every run performed during the broader program belongs in the leaderboard. Some models covered only a selected hard-gap set; some provider attempts stopped under rate limits; some local context and quantization diagnostics finished fewer than 100 valid scenarios; and some runs deliberately changed the harness. An early DeepSeek Flash arm was superseded by a clean rerun and is not reported.
Ranked single-model flows therefore had to use the 100-lab panel, the two-blind-pass schedule and the standard budget, with any incomplete denominator disclosed. Luna’s unconditional second pass was normalized to the common schedule as described above; its capability fold is unchanged, because already-solved scenarios cannot add another solve.
The cost table follows the same rule. Unrelated provider invoices, subscription credits and GPU rental windows do not become benchmark costs by proximity.
Negative and partial experiments remain useful engineering evidence. They are not principal results.
What this benchmark does not prove
Synthetic labs are not live bounty programs
The targets are authorized and designed for deterministic verification. They do not reproduce program scope ambiguity, duplicate risk, production rate limits, WAFs, third-party dependencies, changing data, triage dynamics or legal judgment. A 53/100 lab score is not a 53% live bounty success rate.
Every benchmark lab is vulnerable
Every lab contains an intentionally implemented, reachable vulnerability with a designed path to completion. So what is measured here is exploitation: how far an agent gets when something genuinely is wrong. It does not measure whether an agent can decline to invent a finding on a clean application. That is a separate and equally important capability, and nothing here speaks to it.
Two passes are not a probability estimate
Pass two measures one prescribed recovery attempt on pass-one misses. It is not pass@k sampled across enough independent seeds to estimate a stable probability for every model and lab.
Sampling variance remains
The two blind stages used prescribed seeds, not enough repeated seeds to estimate narrow confidence intervals for every model. A different model revision, route, prompt, harness or sample could change a close ordering, including the one-solve gap at the top.
Effort labels are vendor-specific
“High,” “max” and other provider-facing labels are not standardized compute units. This is a system comparison under available production interfaces, not a controlled FLOP comparison.
Harnesses differed
Opus used Claude Code, Grok used Grok Build, and the remaining principal models used Codex. Tool schemas, context behavior and terminal handling can affect outcomes. The benchmark reports deployed agent systems, not model weights in isolation.
The normalized costs are a snapshot
OpenRouter prices can change. The estimates apply the 28 August 2026 list prices to recorded token classes. They are reproducible comparisons, not future quotes or historical invoices.
Bottom line
No one number selects a model for every hunting workload.
Opus produced the strongest result at 63 solves and 303 rungs for $9.03 per solve. Grok finished one solve behind at 62 / 295 for 58% of Opus’s normalized cost. Qwen Flash and DeepSeek Flash tied at 53 / 270, but Qwen cost $9.97 compared with DeepSeek’s $36.04.
The result supports a straightforward operating rule: choose the standalone model whose solves, rung progress and cost fit the hunting workload, preserve evidence outside the conversation, and use one clean blind retry where the model shows meaningful recovery. A human still owns scope, impact and the report.
The most useful number is not the top of a leaderboard. It is the next independently verified solve per unit of cost, time and risk.
How this was run
Every result above follows one frozen evaluation contract, with the declared model-specific effort and harness differences:
| Panel | 100 labs, four proof rungs each, 400 rungs total |
| Schedule | Blind pass one on all 100 → blind pass two on exact-proof misses → stop |
| Budget | 80 agent turns, 25 minutes per cell |
| Harnesses | Claude Code for Opus; Codex for Sol, Luna, Qwen, DeepSeek and GLM; native Grok Build for Grok 4.6 |
| Evaluation dates | 25–28 August 2026 |
| Pricing | OpenRouter public base list prices, observed 28 August 2026 |
The labs themselves are not published. They are derived from real submitted findings, and releasing them would expose the reports, programs and mechanisms they came from. Raw traces, target proofs, scenario keys, credentials and infrastructure detail stay private for the same reason.